

Who this is for: data center investors and operators, mechanical design teams, procurement and risk functions. Every figure comes from the guidelines and standards named in the text.
The job of a cooling system is not to cool air but to deliver air at the right temperature and humidity, in the right quantity and without interruption, to every server inlet; this guide takes that job apart piece by piece.
Short answer
- The goal is to keep server inlet air within a defined temperature and humidity envelope; the ASHRAE TC 9.9 guideline recommends 18 to 27 °C for air-cooled classes.
- Capacity alone is not enough: cold air escaping to the hot side without passing through the servers (bypass) or hot air returning to the inlets (recirculation) overheats cabinets.
- Condensation is governed by dew point, not relative humidity: water forms on any surface that falls below the dew point.
- Redundancy (N+1, N+2, 2N) keeps cooling running through maintenance and failures; how long cabinets stay within limits during an outage is shown only by a time-dependent analysis.
- Design conditions are derived from past records; in a warming climate, how often they are exceeded changes over the life of the facility.
1. The goal of cooling: the temperature and humidity envelope
The starting point is not comfort but the operating envelope of the equipment: a “recommended” range for temperature and humidity measured at the server inlet, plus “allowable” ranges that widen by equipment class. The most widely used reference is Thermal Guidelines for Data Processing Environments by ASHRAE Technical Committee 9.9. Its fifth edition (2021) keeps the recommended inlet temperature for the air-cooled classes A1 to A4 at 18 to 27 °C, gives the new high-density class H1 a narrower range (18 to 22 °C) and raises the recommended upper relative humidity limit to 70 percent, conditional on low concentrations of pollutant gases in the hall.
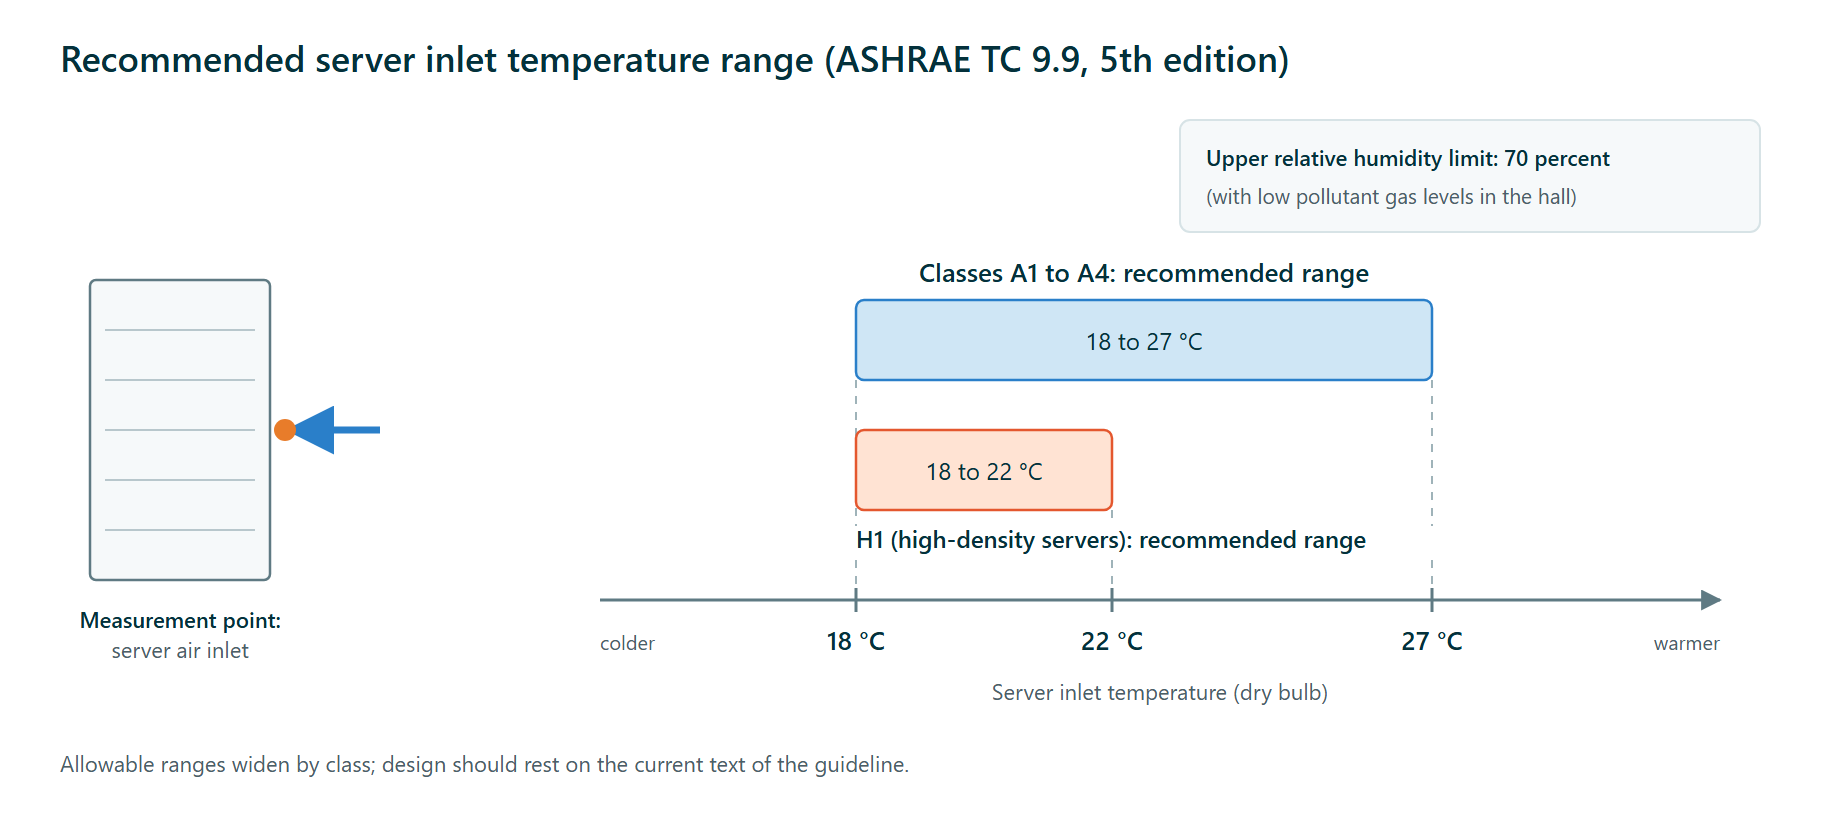
Three practical consequences: what is measured is not capacity but the temperature achieved at the server inlet; moving toward the upper end of the envelope adds free-cooling hours but reduces the margin for error; the humidity limits address electrostatic discharge in dry air and condensation and corrosion in humid air together.
2. Cooling architectures
Cooling systems are classified by how close the cooling sits to the heat source; each approach has a different airflow weak point.
| Architecture | Where cooling happens | Typical equipment | Airflow point to watch |
|---|---|---|---|
| Room-based | At the perimeter of the hall; air distributed through a raised floor or from the ceiling | CRAC (direct expansion) or CRAH (chilled water) units, perforated tiles | Underfloor pressure, tile placement; bypass and recirculation along a long air path |
| Row-based | Inside or next to the cabinet row | In-row units, usually with hot-aisle containment | Short air path; a unit failure affects neighboring cabinets |
| Cabinet-based | In the cabinet itself | Rear-door heat exchangers, enclosed cabinets | Capacity per cabinet; water or refrigerant lines inside the hall |
| Liquid cooling | Directly at the chip or by immersion | Cold-plate loops, immersion tanks, coolant distribution units | Does not remove air cooling entirely; the remaining heat and hall humidity stay on the air side |
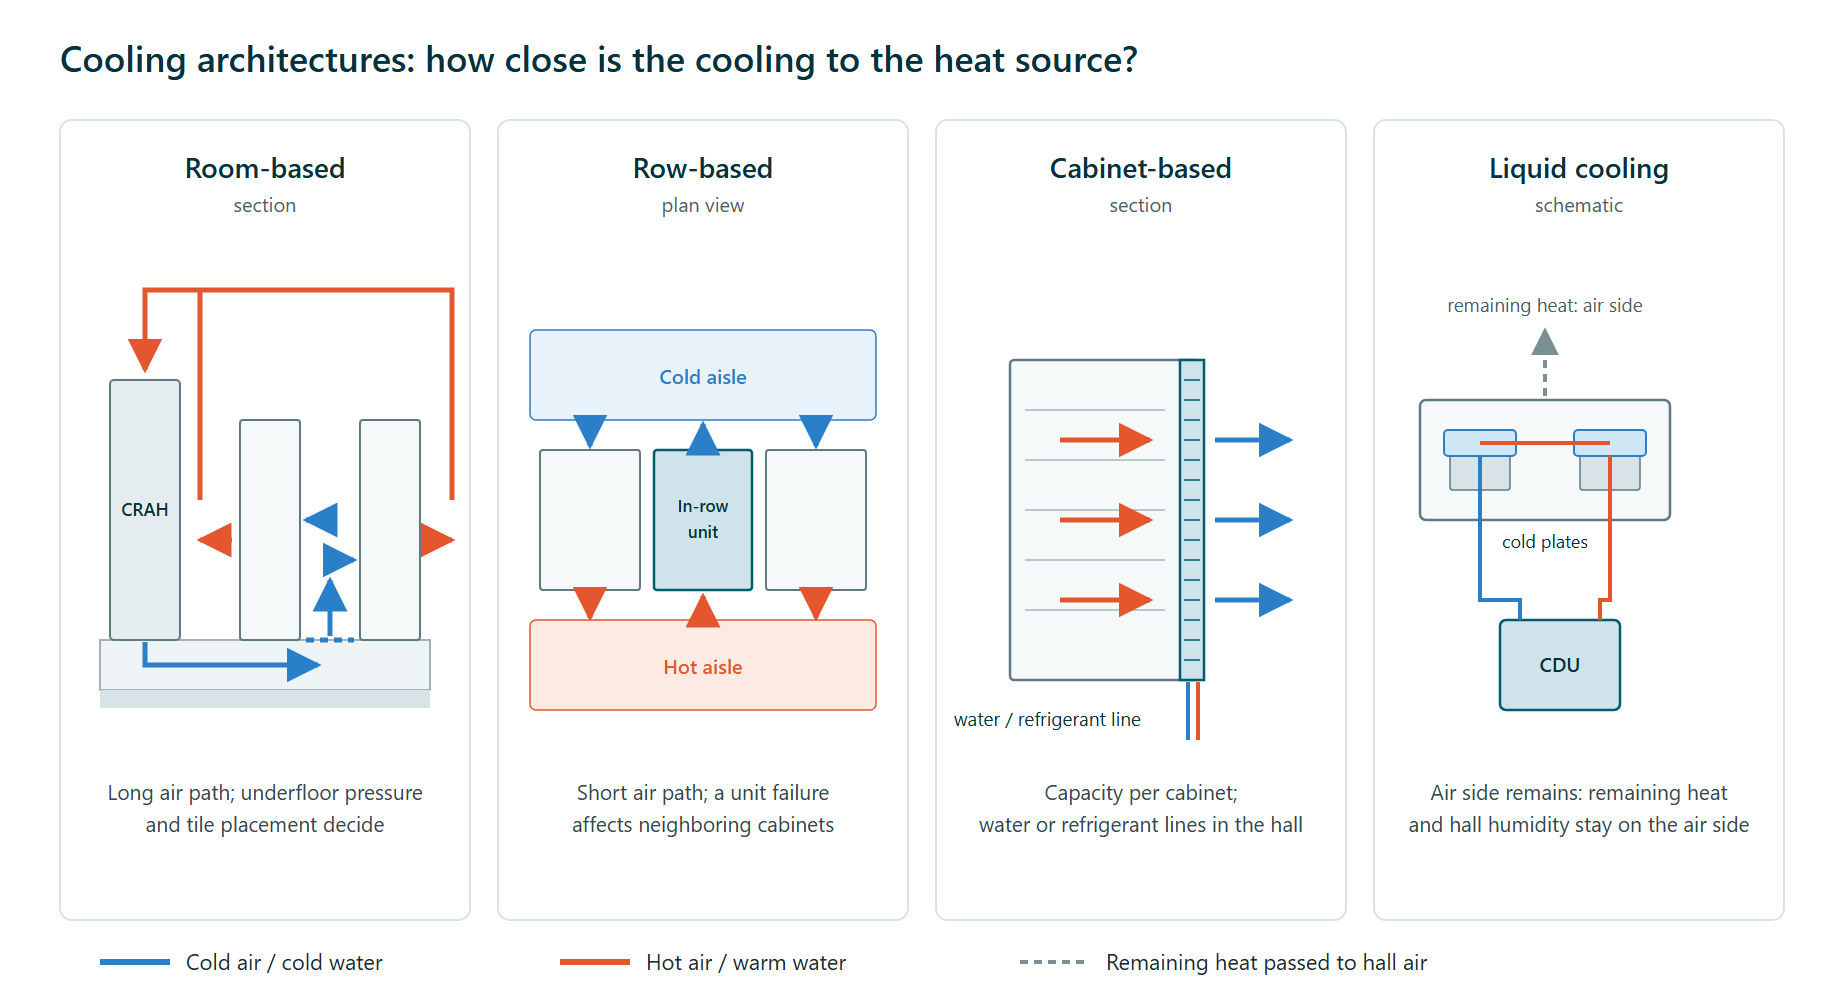
With a raised floor, cold air is pushed into the underfloor plenum and emerges through perforated tiles into the cold aisle; the most overlooked problem is underfloor congestion: when cable trays and pipework narrow the flow path, the tiles at the end of the aisle may not receive enough air (our post on underfloor congestion).
Liquid cooling is entering mainstream facilities because of the trend in processor power and density; ASHRAE TC 9.9 addressed this transition in a 2021 white paper and defines liquid cooling classes by facility water supply temperature. The air side remains: part of the heat still reaches the hall air, and humidity and condensation control stay on the air side.
Free cooling
Using outdoor air instead of mechanical cooling when it is cold and dry enough is called free cooling: on the air side with direct or indirect economizers, on the water side with dry coolers or cooling towers. The length of the window depends on the site’s climate and the upper limit of the envelope, so the station and record behind the design conditions directly affect the energy calculation. At an example site we showed that the free-cooling window is 454 to 557 hours per year wider than the nearest weather station suggests; see our review of ASHRAE design conditions. Because the gap grows largest at night and in winter, it affects the energy calculation far more than the peak capacity.
3. Airflow management: hot and cold aisles, bypass, recirculation
The aim is simple: cold air should reach only the server inlets, hot air only the intakes of the cooling units. When cabinets face each other, a cold aisle forms between them and hot aisles behind them; containment physically keeps the two streams apart.
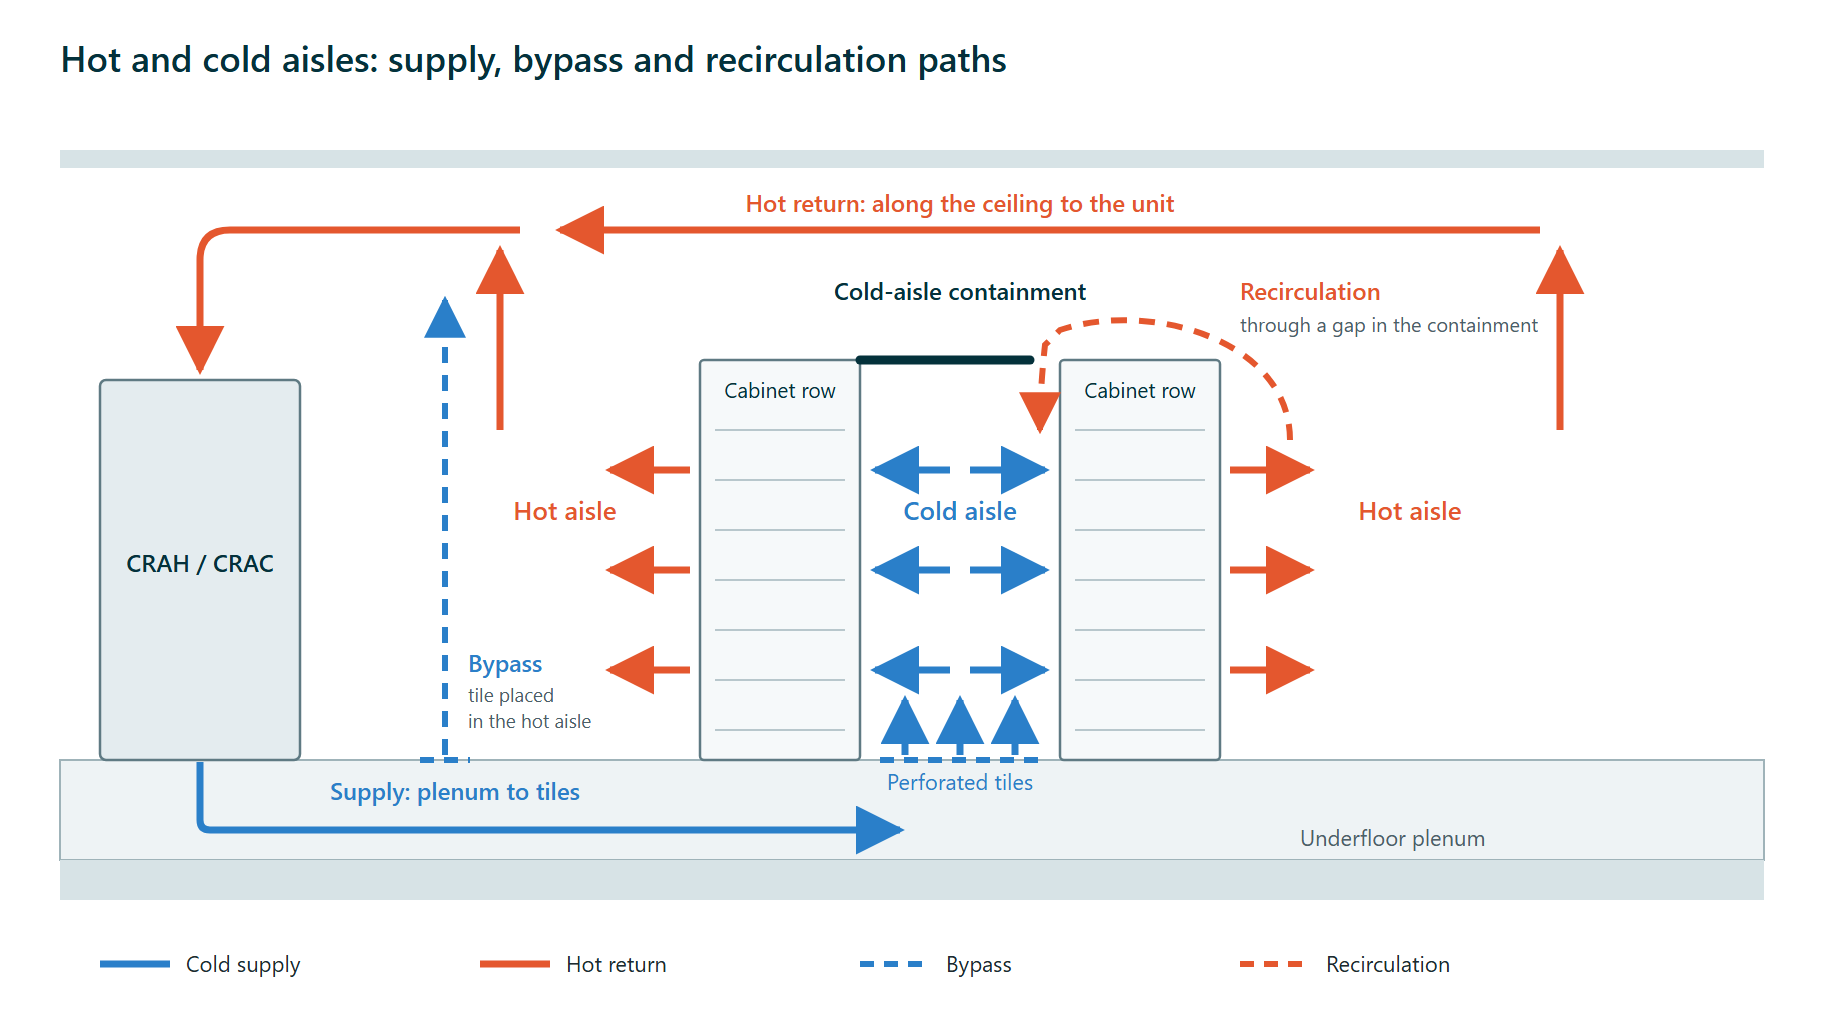
Bypass is cooled air returning to the hot side without passing through the servers; unfilled cabinet openings, cable cut-outs and perforated tiles outside the cold aisle are the typical routes. Recirculation is hot air returning to the server inlets; it appears at the ends and above the tops of rows without containment. In both cases the unit runs and consumes energy, yet the target inlet temperature is not achieved.
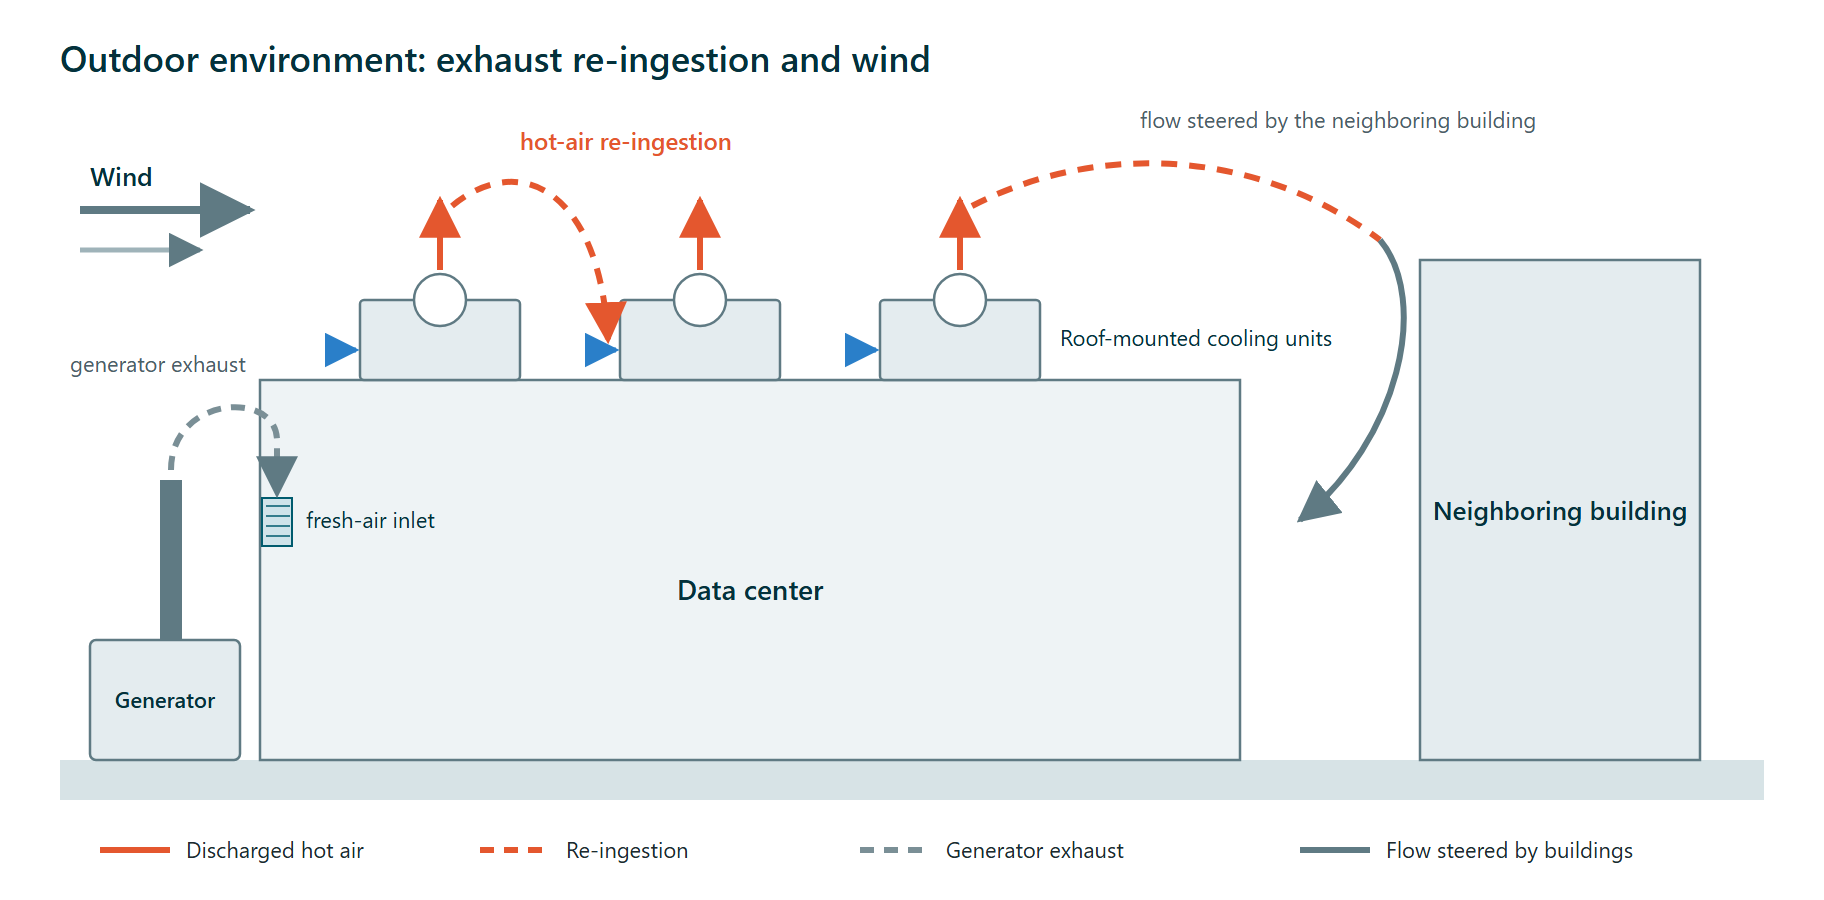
The outdoor counterpart is the bypass ratio: the share of hot air discharged by roof-mounted units that returns to the intakes, which depends on wind direction. The definition and a worked example are in our bypass ratio post, results for eight wind directions in wind direction and bypass ratio.
4. Temperature, humidity and condensation control
The key to humidity control is the dew point: the temperature at which the water vapor in the air begins to condense; unlike relative humidity it does not change as the air warms up. Water forms on any surface that falls below the dew point; the surfaces at risk are chilled-water pipes and valves, cooling coils, economizer transitions that admit outdoor air, and equipment close to cold external walls.
Humidity is therefore limited at both ends: dry air raises the risk of electrostatic discharge, humid air the risk of condensation and corrosion; the ASHRAE envelope defines humidity limits in terms of dew point as well. In operation three questions suffice: the dew point of the hall air, the temperature of the coldest surface, and whether the margin between them survives changing outdoor conditions (outdoor air admitted on a humid summer day). Condensation usually appears not on the design day but during transitions.
5. The logic of the cooling load
The essence of the calculation is that almost all of the electrical power entering the hall turns into heat. The main item is the power drawn by the IT equipment; lighting, people, heat through external walls, uninterruptible power supply and distribution losses, and the fan and pump heat of the cooling units are added. As a peak value the total sets the capacity, as an hourly profile the annual energy.
The traps lie in the assumptions: installed power and drawn power are not the same, and facilities spend most of their lives at part load; density per cabinet can differ widely from the average, and hot spots do not show up in an average; the outdoor design condition sets capacity, its distribution through the year sets energy. The calculation is therefore done with a peak condition for capacity and with hourly climate data for energy and free cooling (on choosing the outdoor condition, see section 8).
6. Redundancy and thermal resilience during an outage
Redundancy means the load continues to be met when one part of the cooling system is under maintenance or has failed: N is the capacity required, N+1 one extra unit, N+2 two extra units, 2N two fully independent systems. The Uptime Institute Tier system defines four levels: Tier I basic capacity, Tier II redundant capacity components, Tier III concurrently maintainable (no shutdown is needed for maintenance), Tier IV fault tolerant (a single failure or the loss of a distribution path does not interrupt operations) with continuous cooling. EN 50600 defines availability classes 1 to 4 for power distribution, environmental control (cooling) and telecommunications cabling; the class of a facility is the lowest of the three (environmental control: EN 50600-2-3).
Redundancy does not describe behavior during an outage. When utility power is lost the compressors stop; until the generator starts and the compressors restart, the hall is cooled only by the fans and, where present, pumps fed from the uninterruptible power supply and by thermal inertia. How long cabinet inlets stay within limits depends on cabinet density, air volume, containment and chilled-water storage; a static calculation cannot give that duration, only a time-dependent (transient) analysis can (our data center CFD analysis service page).
7. The outdoor environment: exhaust re-ingestion and wind
Part of the cooling performance is lost outside the building. Hot air discharged by roof-mounted units and generator exhaust can return to the intakes of neighboring units or to fresh-air inlets depending on wind direction and building geometry; the result is reduced condenser capacity, degraded generator intake air and an effect on indoor air quality. An indoor model does not show this; it takes an external flow model with surrounding buildings, terrain roughness and the prevailing and worst-case wind directions (data center exhaust dispersion analysis).
8. How a changing climate affects design conditions
Design condition tables are derived from past observations and describe a weather station. They have three limits: a short record window hides the warming trend; the station is not your site, and the gap is felt mostly at night; the table does not include the shift expected over the life of the facility. At an example station, the trend in the cooling design temperature comes out at +0.05 K per decade and “not significant” when only the latest 25-year window is used, but at +0.61 K per decade and clearly significant over the full record; over a 30-year facility life that rate corresponds to a shift of about +1.8 K. The same study measured the heating design value (99.6%) as 2.1 K optimistic at the site; the free-cooling gap is in section 2, and all findings are in our technical review.
In a warming climate the real question is how many days a year today’s design temperature will be exceeded over the life of the facility, and how capacity, the free-cooling window and the resilience time will change on those days. Extreme heat is not the only risk: drought and water stress affect the water supply and the dust and filter load of evaporative cooling, sudden heavy rainfall tests site drainage, and storms and lightning affect outdoor units and power lines. These risks belong at the table from the start of investment and design decisions; we describe the approach, from physical analysis through climate projection to financial reporting, on our climate-resilient data center page.
9. What PUE tells you, and what it does not
Power usage effectiveness (PUE) is the ratio of the total energy consumption of the data center to the energy consumption of the IT equipment; it is defined in ISO/IEC 30134-2, and by definition the calculated PUE is always greater than 1. The standard defines three measurement categories (PUE1, PUE2, PUE3) according to where the measurement is taken; the higher the category, the closer the measurement is to the devices consuming the energy. The 2026 edition of the standard was published in January 2026; in Europe the same indicator is EN 50600-4-2.
PUE tells you how much additional energy the infrastructure consumes per unit of IT load; it does not tell you the efficiency of the IT equipment itself, the rise of the ratio at part load, the influence of climate (the same design gives different PUE values in different climates) or resilience. A comparison requires the same measurement category, period and load ratio.
10. Where CFD analysis adds value
Computational fluid dynamics (CFD) solves the airflow, temperature distribution and time-dependent behavior in the hall and around the building numerically. Where it adds value: concept and scheme design, while layout and air distribution can still change; verification of redundancy scenarios (one unit out of service) at cabinet level; the duration of transitions such as a grid outage; exhaust re-ingestion and wind effects outdoors; hidden hot spots in existing facilities before a capacity uplift. It does not replace commissioning measurements and monitoring: they show what is happening on site, CFD shows what has not yet been built or has not yet happened.
At Alkazar we organize data center CFD work into four service lines: external flow and facade, white space, grey space and transient resilience; scenario sets and deliverables are explained on our data center CFD analysis page. Methodology details and the validation chain belong to Alkazar.
11. Standards and guidelines: which document governs what
| Document | Publisher | What it governs |
|---|---|---|
| Thermal Guidelines for Data Processing Environments, 5th edition (2021) | ASHRAE TC 9.9 | Recommended and allowable temperature and humidity envelopes for air-cooled classes; the high-density class; liquid cooling classes |
| EN 50600 series (EN 50600-1 general concepts; EN 50600-2-2 power; EN 50600-2-3 environmental control; EN 50600-2-5 physical security; EN 50600-4-2 PUE) | CENELEC | Design availability classes 1 to 4; requirements and recommendations for environmental control systems; energy performance indicators |
| ISO/IEC 30134-2 (2016; new edition 2026) | ISO/IEC | Definition of PUE, measurement categories, calculation and reporting |
| Tier Classification System | Uptime Institute | Infrastructure topology classification from Tier I to Tier IV; concurrent maintainability and fault tolerance |
None of these documents replaces another: the ASHRAE envelope defines the target, EN 50600 and the Tier classification the resilience level, ISO/IEC 30134-2 how the energy indicator is measured. Standards are copyrighted; this guide only shows which document answers which question.
Frequently asked questions
What types of data center cooling systems are there?
By proximity: room-, row- and cabinet-based systems and liquid cooling; by heat rejection: direct expansion, chilled water and free cooling (section 2).
Is there a difference between data center cooling and air conditioning?
Cooling removes heat; air conditioning controls temperature, humidity and air quality together; in a data center the two cannot be separated.
Why does airflow management matter as much as capacity?
Bypass and recirculation defeat the target inlet temperature even with sufficient capacity; containment, blanking panels and sealed cut-outs reduce the loss (section 3).
What is the bypass ratio?
For outdoor units, the share of discharged hot air that returns to the intake; it depends on wind direction (worked example: bypass ratio post).
How is condensation controlled in a data center?
By preserving the safety margin between the dew point and the coldest surface: chilled-water temperature, pipe insulation, humidity control when admitting outdoor air (section 4).
How is the cooling load calculated?
Internal heat gains and infrastructure losses are added to the IT power; peak outdoor condition for capacity, hourly climate data for energy (section 5).
How does air conditioning differ in a Tier IV data center?
Tier IV means fault-tolerant infrastructure with continuous cooling: fully redundant, independent systems and arrangements that keep cooling going during an outage (section 6).
When should data center CFD analysis be carried out?
At concept and scheme design, while layout and air distribution can still change; also for verification and before a capacity uplift (data center CFD analysis).
Sources
- ASHRAE Technical Committee 9.9, Thermal Guidelines for Data Processing Environments, 5th edition, ASHRAE, 2021 (copyrighted publication). Summary of the changes in the fifth edition: Uptime Institute Journal, “New ASHRAE guidelines challenge efficiency drive”, 21 October 2021: journal.uptimeinstitute.com
- ASHRAE TC 9.9, “Emergence and Expansion of Liquid Cooling in Mainstream Data Centers”, white paper, 7 May 2021: ashrae.org (PDF)
- CEN-CENELEC-ETSI Coordination Group on Green Data Centres, “Review of standardisation activities: Energy Management and Environmental Viability of Data Centres”, summary of the 11th edition, 2024 (parts of the EN 50600 series and availability classes): cencenelec.eu (PDF)
- ISO/IEC 30134-2, Information technology, Data centres key performance indicators, Part 2: Power usage effectiveness (PUE); 2016 edition and the new edition of January 2026: iso.org
- Uptime Institute, Tier Classification System: uptimeinstitute.com
- Alkazar technical reviews: ASHRAE design conditions: station, site and horizon; bypass ratio; wind direction and bypass ratio.
This guide is for information; design decisions should rest on the current text of the relevant standard and on site-specific analysis. For questions, get in touch.